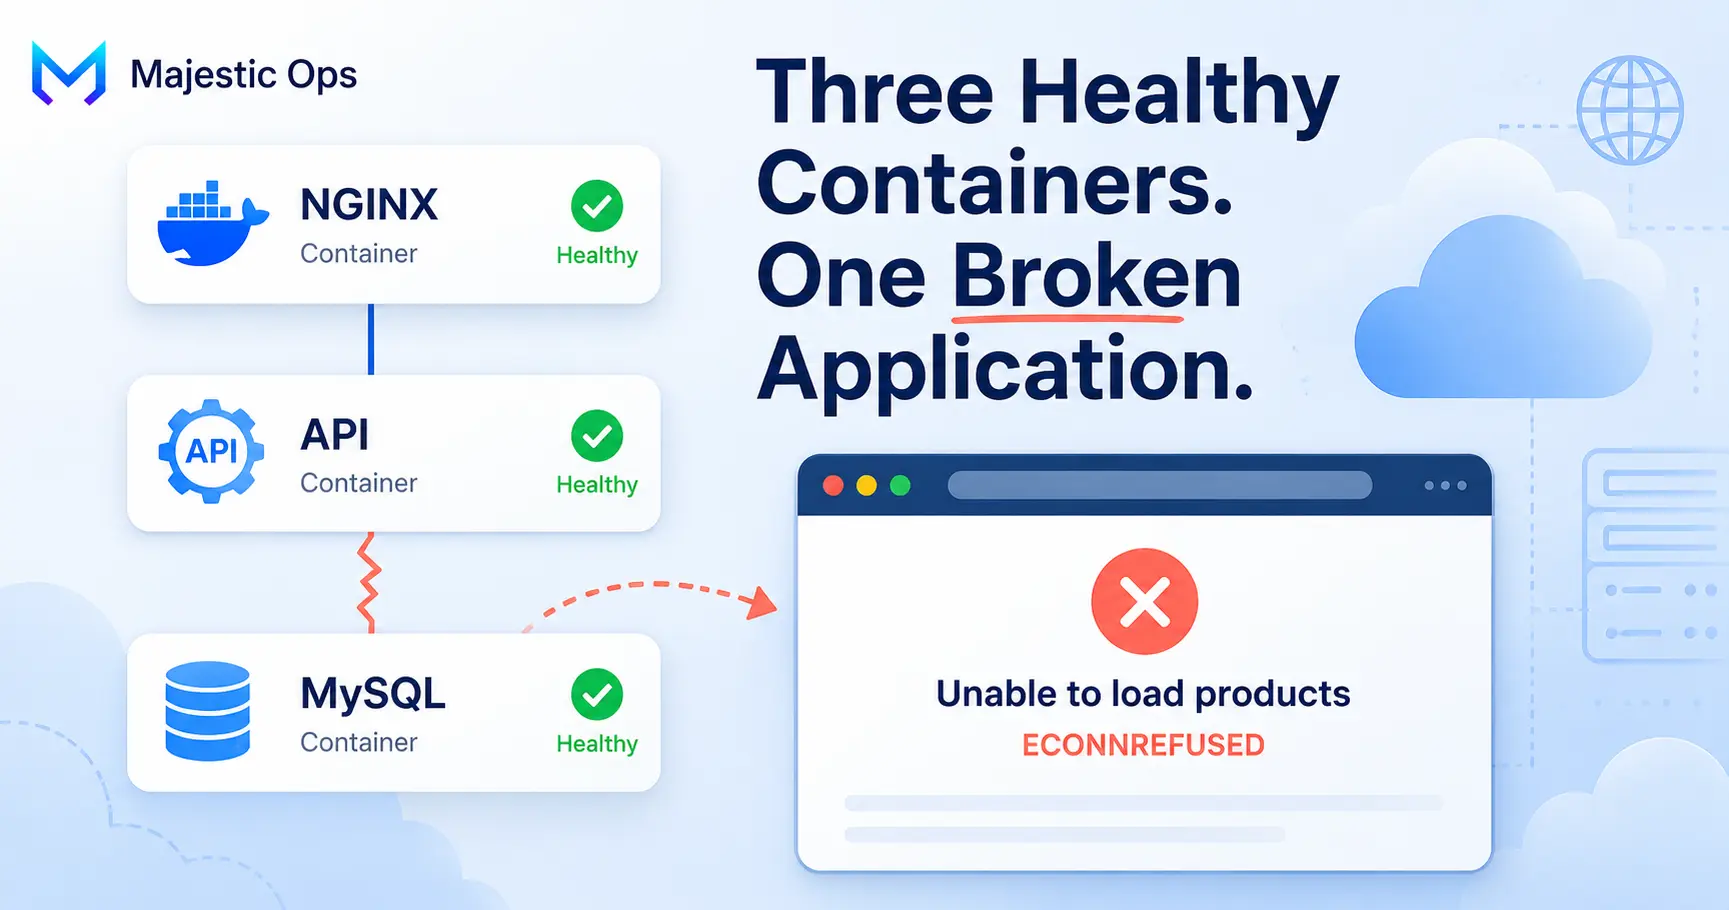
Imagine you're running multiple microservices on a Kubernetes cluster with Prometheus collecting metrics and Grafana monitoring CPU, memory, requests, and network traffic. Everything looks healthy, and no alerts are firing. Then, during a routine review, you discover a pod communicating with an unknown external IP address. The surprising part? None of the dashboards reported anything unusual. CPU and memory usage remained normal, and the application continued serving traffic without issues.
Further investigation revealed a reverse shell running inside the container — giving an attacker interactive access to the workload.
Traditional monitoring tools can tell us whether an application is healthy, but they often cannot show what is actually happening inside a container at runtime. To uncover the suspicious activity, we needed deeper visibility into process execution and network connections. This is where Tetragon and eBPF come in.
What is eBPF?
eBPF (extended Berkeley Packet Filter) is a feature of the Linux kernel that lets you run small programs inside the kernel itself — without modifying the kernel source code or rebooting the machine.
Tetragon: Runtime Visibility for Kubernetes
Tetragon is an open-source eBPF security tool built by Cilium. It runs as a DaemonSet on Kubernetes — one pod per node — and uses eBPF to observe everything happening at the kernel level across all containers on that node.
You tell Tetragon what to watch using TracingPolicies — Kubernetes custom resources that define which kernel functions or syscalls to hook into. Tetragon enriches every kernel event with Kubernetes context such as the pod name, namespace, container ID, process, and parent process. This allows you to trace exactly what happened inside a container, not just that something happened.
How Tracing Policies Work
Imagine installing CCTV cameras in a building. The cameras can record everything, but watching every second of footage would be overwhelming. Instead, you configure them to alert you only when specific events occur — such as someone entering a restricted room.
TracingPolicies work the same way. Instead of monitoring every kernel event happening inside Kubernetes, Tetragon watches only for the activities you define. For example, you can create policies to detect:
- Reverse shell execution
- Privilege escalation attempts
- Suspicious network connections
- Sensitive file access
- Container escape behavior
Whenever one of these activities occurs, Tetragon captures the event and enriches it with Kubernetes context such as the pod name, namespace, process, and container information.
Prerequisites
To set up a complete Kubernetes kernel-level monitoring system you need:
- A running Kubernetes cluster
- Prometheus installed on a dedicated namespace
- Grafana installed on the same namespace as Prometheus
- Helm 3.x
- kubectl configured
Installation
Step 1: Add the Helm Repository
helm repo add cilium https://helm.cilium.iohelm repo update
Step 2: Update Chart Dependencies
helm dependency update ./helm-chart-folder
Step 3: Install Tetragon
helm install tetragon-poc ./tetragon-poc \--namespace tetragon-poc \--create-namespace \-f values.yaml
Step 4: Verify the Installation
# Check podskubectl get pods -n tetragon-poc# Check tracing policieskubectl get tracingpolicy# Check service monitorkubectl get servicemonitor -n tetragon-poc# Check Prometheus alertskubectl get prometheusrule -n tetragon-poc# Check Grafana dashboard configmapkubectl get configmap -n monitoring | grep tetragon
Building a Reverse Shell Detection Tracing Policy
We will create a TracingPolicy that watches for reverse shell activity and alerts us whenever a container attempts to establish a suspicious outbound connection.
Step 1: API Declaration
Every Tetragon policy starts with the Kubernetes CRD header. Tetragon uses Cilium's cilium.io/v1alpha1 API group.
apiVersion: cilium.io/v1alpha1kind: TracingPolicy
Step 2: Metadata
Name the policy and add labels so Helm can track and manage it.
metadata:name: reverse-shell-monitoringlabels:app.kubernetes.io/managed-by: Helmapp.kubernetes.io/part-of: tetragon-poc
Step 3: Choose the Hook Type
Tetragon supports two primary hook types:
| Hook Type | When to Use |
|---|---|
| Kprobes | Intercept kernel functions like tcp_connect |
| Tracepoints | Intercept syscalls at a stable kernel tracepoint |
Reverse shell detection watches the dup2 syscall, so we use tracepoints.
spec:tracepoints:- subsystem: "syscalls"event: "sys_enter_dup2"
sys_enter_dup2 fires the moment any process calls dup2() — before the kernel executes it.
Step 4: Declare the Arguments to Capture
dup2(oldfd, newfd) takes two arguments. We declare both so Tetragon knows their types and positions.
args:- index: 0 # oldfd — the source file descriptor (e.g. a socket)type: "int64"- index: 1 # newfd — the destination (stdin=0, stdout=1, stderr=2)type: "int64"
Step 5: Add the Selector (The Detection Logic)
This is where the actual detection happens. We match on index: 1 (the newfd argument) being 0, 1, or 2 — because a reverse shell always redirects the socket to stdin, stdout, or stderr.
selectors:- matchArgs:- index: 1operator: "Equal"values:- "0" # stdin — fd 0- "1" # stdout — fd 1- "2" # stderr — fd 2
Complete Policy
{{- if .Values.tracingPolicies.reverseShell.enabled }}---apiVersion: cilium.io/v1alpha1kind: TracingPolicymetadata:name: {{ .Values.tracingPolicies.reverseShell.name }}labels:app.kubernetes.io/managed-by: Helmapp.kubernetes.io/part-of: tetragon-reverseshellspec:tracepoints:- subsystem: "syscalls"event: "sys_enter_dup2"args:- index: 0type: "int64"- index: 1type: "int64"selectors:- matchArgs:- index: 1operator: "Equal"values:- "0" # stdin- "1" # stdout- "2" # stderr{{- end }}
How Does a Tracing Policy Detect a Reverse Shell?
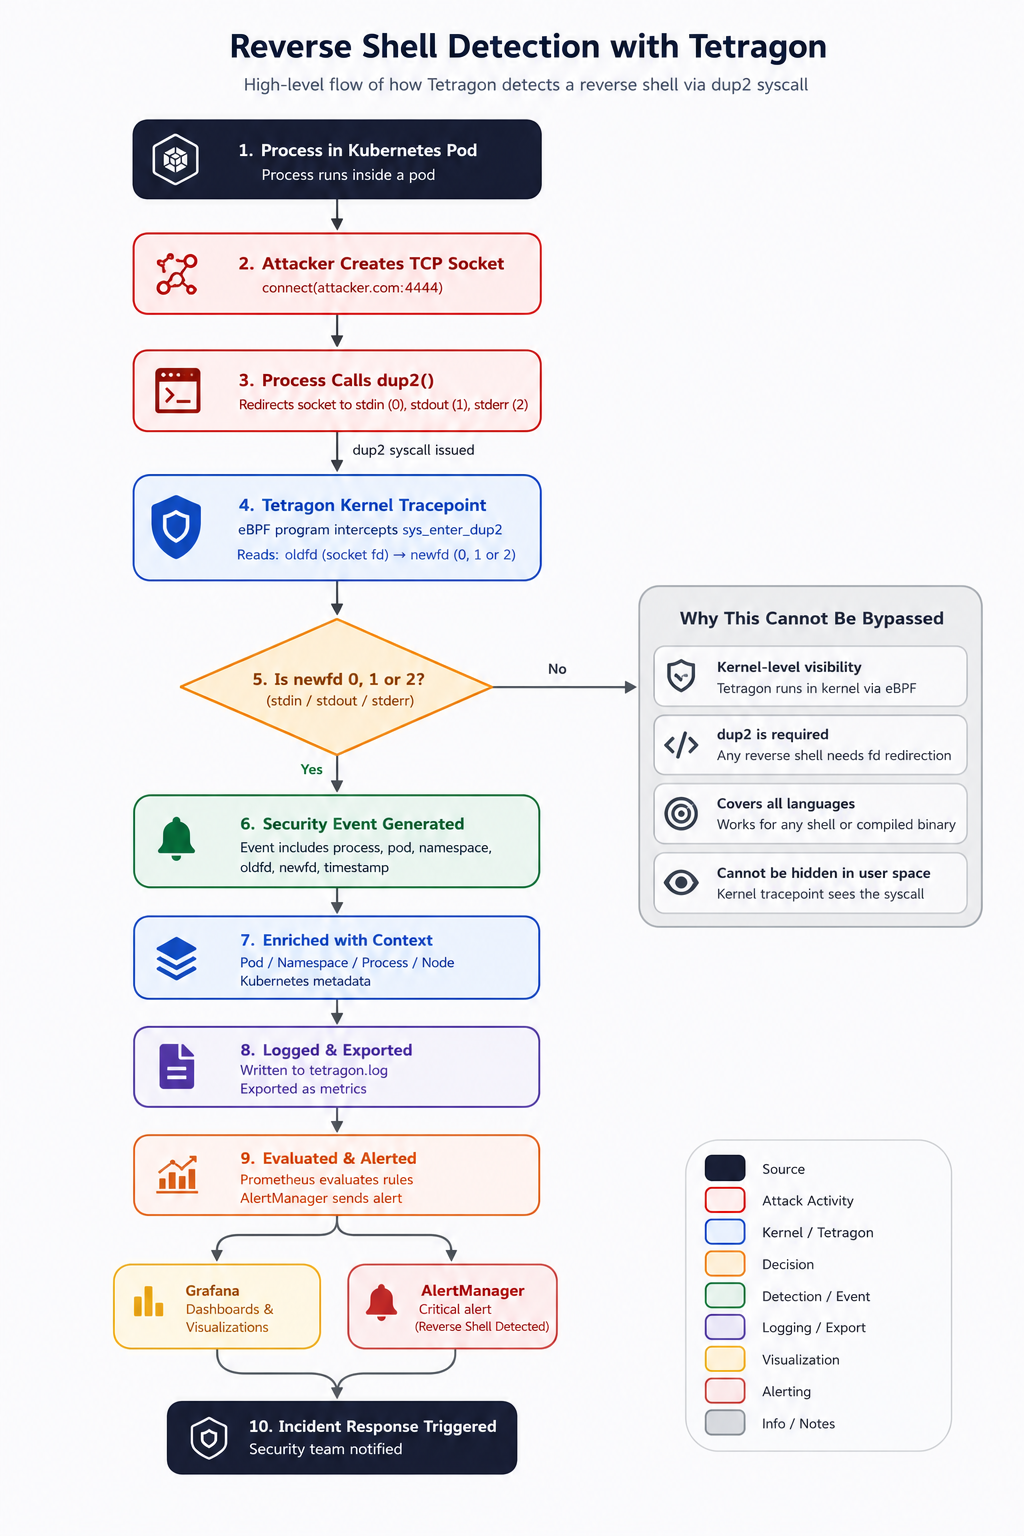
The diagram above illustrates the complete lifecycle of how Tetragon detects a reverse shell attack inside a Kubernetes environment.
- An application or process is running inside a Kubernetes pod.
- An attacker gains access and establishes an outbound TCP connection back to their machine.
- To make the shell interactive, the attacker redirects the socket to stdin, stdout, and stderr using the
dup2()syscall. - Tetragon, using eBPF programs attached to Linux kernel tracepoints, intercepts the
dup2()call in real time. - Tetragon checks whether the new file descriptor maps to stdin (0), stdout (1), or stderr (2). Matching any of these is a strong indicator of a reverse shell.
- Tetragon generates a security event.
- The event is enriched with Kubernetes context — pod name, namespace, process information, and node details.
- The event is logged and exported. Prometheus collects the generated metrics, and Grafana visualizes them through dashboards.
- AlertManager evaluates the alerting rules and triggers notifications when suspicious activity is detected.
- The security team receives an alert and can begin incident response before the attacker gains deeper access.
Simulating a Reverse Shell Attack
You can verify the detection is working by simulating the attack without an actual attacker listening:
kubectl exec test-pod -n monitoring -- python3 -c \"import socket,os; s=socket.socket(); os.dup2(s.fileno(),0); os.dup2(s.fileno(),1); os.dup2(s.fileno(),2)"
This opens a socket and calls dup2 three times — redirecting stdin, stdout, and stderr to it. The connection itself will fail (no attacker listening), but Tetragon fires three events — one for each dup2 call hitting fd 0, 1, and 2.
Those events appear immediately in Grafana and trigger the TetragonReverseShellDetected alert in AlertManager.
Conclusion
In our scenario, Grafana showed healthy metrics, Prometheus continued collecting data, and the application remained available. From an operational perspective, everything appeared normal. However, a reverse shell running inside the container told a very different story.
Traditional monitoring tools are excellent at measuring application health, but they often lack visibility into what processes are actually doing at runtime. By combining eBPF with Tetragon TracingPolicies, we were able to observe kernel-level activity, detect suspicious behavior, and generate alerts before the issue escalated further.
The biggest lesson is simple: healthy metrics do not always mean a secure environment. Runtime visibility adds an additional layer of defense that helps security and platform teams understand what is happening inside containers — not just whether the application is responding.
If your organization already uses Kubernetes, Prometheus, and Grafana, tools like Tetragon can significantly improve your ability to detect threats that traditional monitoring platforms may never see.
FAQ
1. Can Grafana detect reverse shell attacks? Not directly. Grafana visualizes metrics and logs collected from monitoring systems, but it does not provide kernel-level visibility into process execution or system calls.
2. What is a reverse shell attack? A reverse shell is a technique that allows an attacker to gain command-line access to a compromised system by forcing the target to establish a connection back to the attacker's machine.
3. What is a TracingPolicy in Tetragon? A TracingPolicy is a Kubernetes custom resource that defines which kernel events Tetragon should monitor. Policies can be used to detect reverse shells, privilege escalation attempts, suspicious network connections, and other security-related activities.
4. Why does Tetragon use eBPF? eBPF allows Tetragon to observe kernel-level events without modifying the Linux kernel or restarting workloads, providing deep visibility into container activity with minimal overhead.
5. Can Tetragon work without Prometheus and Grafana? Yes. Tetragon can capture and export security events independently. Prometheus and Grafana simply provide a convenient way to collect, visualize, and alert on those events.